Do you want to subscribe?
Subscribe today.
Cancel SubscribeWhen you open this pub again using this browser, you'll be returned to this page. When you move to the next page the bookmark will be moved to that page (if you move back the bookmark will remain on the furthest page to which you've read). By touching the bookmark you can set the bookmark to whichever page you are on.
More bookmark features coming soon.
You must login to publish and add your own notes. Eventually you will be able to see others contributions if they make them public.
More notes features coming soon.
James Hansena,1,23, Pushker Kharechaa, Makiko Satoa, Frank Ackermanb, Paul J. Heartyc, Ove
Rahmstorfh, Johan Rockstromi, Eelco J. Rohlingj, Jeffrey Sachsk, Pete Smithl, Konrad Steffenm, Lise Van Susterenn, Karina von Schuckmanno, James C. Zachosp,
a NASA Goddard Institute for Space Studies and Columbia University Earth Institute, New York, NY 10025, bStockholm Environment
de la Recherche Scientifique, LOCEAN, Paris (hosted by Ifremer, Brest), France, pEarth and Planetary Science, University of California at Santa Cruz
Humanity is now the dominant force driving changes of Earth's atmospheric composition and thus future climate (1). The principal climate forcing is carbon dioxide (CO2) from fossil fuel emissions, much of which will remain in the atmosphere for millennia (1, 2).
The climate response to this forcing and society's response to climate change are complicated by the system's inertia, mainly due to the ocean and the ice sheets on Greenland and Antarctica. This inertia causes climate to appear to respond slowly to this
Governments have recognized the need to limit emissions to avoid dangerous human- made climate change, as formalized in the Framework Convention on Climate Change (3), but only a few nations have made substantial progress in reducing emissions. The stark reality (4) is that global emissions are accelerating and new efforts are underway to massively expand fossil fuel extraction, by oil drilling to increasing ocean depths, into the Arctic, and onto environmentally fragile public lands; squeezing of oil from tar sands and tar shale; hydro- fracking to expand extraction of natural gas; and increased mining of coal via mechanized longwall mining and
1Author contributions: J.H. conceived and drafted the paper, based on inputs from and multiple iterations with all
2The authors declare no conflict of interest.
3To whom correspondence should be addressed: james.e.hansen@nasa.gov
1
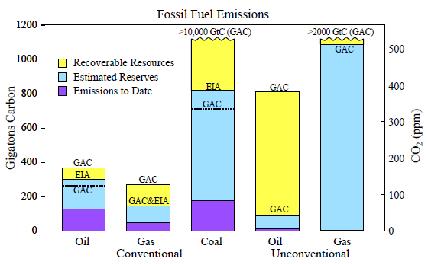
Fig. P1. CO2 emissions by fossil fuels (1 ppm CO2 ~ 2.12 GtC). Estimated reserves and potentially recoverable resources are from EIA (9) and GAC (10).
Governments not only allow this activity, but use public funds to subsidize fossil fuels at a rate of
Fossil fuel emissions to date are only a small fraction of potential emissions from known reserves and potentially recoverable resources (Fig. P1). Although there are uncertainties in reserves and resources, ongoing fossil fuel subsidies and continuing technological advances ensure that more and more of these fuels will be economically recoverable.
Burning all fossil fuels would create a very different planet than the one that humanity knows. The paleoclimate record and ongoing climate change make it clear that the climate system would be pushed beyond tipping points, setting in motion irreversible changes, including ice sheet disintegration with a continually adjusting shoreline, extermination of a substantial fraction of species on the planet, and increasingly devastating regional climate extremes.
Earth's paleoclimate history helps us assess levels of global temperature consistent with maintaining a planet resembling that to which civilization is adapted, for example, avoiding sea level rise of many meters. Earth's measured energy imbalance during a time of minimum solar irradiance, with Earth absorbing more solar energy than the heat energy it radiates to space, confirms the dominant effect of increasing atmospheric CO2 on global temperature (11) and allows us to determine fossil fuel emission reductions needed to restore Earth's energy balance, which is the basic requirement for stabilizing climate.
We conclude that initiation of
The implication is that we must transition rapidly to a
2
system that does not incorporate the full cost of fossil fuels. Fossil fuels are cheap only because they are subsidized, and because they do not pay their costs to society. The high costs to human health, food production, and natural ecosystems of air and water pollution caused by fossil fuel extraction and use are borne by the public. Similarly, costs of climate change and ocean acidification will be borne by the public, especially by young people and future generations.
Thus the essential underlying policy is for emissions of CO2 to come with a price that allows these costs to be internalized within the economics of energy use. The price should rise over decades to enable people and businesses to efficiently adjust their lifestyles and investments to minimize costs.
Fundamental change is unlikely without public support. Gaining that support requires widespread recognition that a prompt orderly transition to the post fossil fuel world, via a rising price on carbon emissions, is technically feasible and may even be economically beneficial apart from the benefits to climate.
The most basic matter is not one of economics, however. It is a matter of morality – a matter of intergenerational justice. As with the earlier great moral issue of slavery, an injustice done by one race of humans to another, so the injustice of one generation to all those to come must stir the public's conscience to the point of action.
1.Intergovernmental Panel on Climate Change (IPCC), 2007: Climate Change 2007: The Physical Science Basis, Solomon, S., et al. eds., Cambridge University Press, 996 pp.
2.Archer, D., 2005: Fate of fossil fuel CO2 in geologic time. J Geophy Res, 110, C09S05.
3.United Nations Framework Convention on Climate Change (FCCC), 1992: United Nations, http://www.unfccc.int.
4.Krauss, C., 2010: There will be fuel. New York Times, Page F1, New York edition, November 17, 2010.
5.G20 Summit Team, 2010: Analysis of the Scope of Energy Subsidies and Suggestions for the
6.Cohen, A.J., et al., 2005: The Global Burden of Disease Due to Outdoor Air Pollution. J Toxicol Environ Health, Part A, 68,
7.Intergovernmental Panel on Climate Change (IPCC), 2007: Climate Change 2007, Impacts, Adaptation and Vulnerability, M.L. Parry, E. A. ed., Cambridge Univ Press, 996 pp.
8.Ackerman, F. and Stanton, E.A., 2011: Climate Risks and Carbon Prices: Revising the Social Cost of Carbon:
9.Energy Information Administration (EIA), 2011: International Energy Outlook: http://www.eia.gov/forecasts/ieo/pdf/0484(2011).pdf accessed Sep 2011.
10.German Advisory Council on Global Change (GAC), 2011: World in Transition - A Social Contract for Sustainability.:
11.Hansen, J., Sato, M., Kharecha, P., and von Schuckmann, K., 2011: Earth's energy imbalance and implications. Atmos Chem Phys, 11,
3
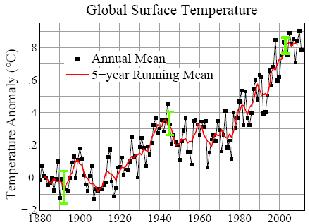
Fig. 1. Global surface temperature anomalies relative to
Global warming due to
We seek to clarify and quantify the urgency of phasing out fossil fuel emissions for the sake of avoiding disastrous climate change. We use Earth's paleoclimate history to determine the levels of global temperature that are consistent with maintaining a planet resembling that to which civilization is adapted. We use a tested carbon cycle model and a simple representation of global temperature and climate sensitivity consistent with paleoclimate data to determine the fossil fuel emission reductions that will be required to restore Earth's energy balance, which is the basic requirement for stabilizing climate. We also discuss the moral issues, our obligations to young people, future generations, less developed nations, indigenous people, and our fellow species.
Global Temperature
Global surface temperature fluctuates stochastically and also responds to natural and human- made climate forcings. Forcings are imposed perturbations of Earth's energy balance such as changes of the sun's luminosity and
Modern Temperature. Temperature change in the past century (Fig. 1) includes unforced variability and forced climate change. Unusual global warmth in 1998 was due to the strongest El Niño of the century, a temporary warming in the tropics caused by an irregular oscillation of the tropical
4
from the Mount Pinatubo volcanic eruption, which reduced sunlight reaching Earth's surface as much as 2%. The
The basic physics underlying this global warming, the greenhouse effect, is simple. An increase of gases such as CO2 has little effect on incoming sunlight but makes the atmosphere more opaque at infrared wavelengths that radiate heat to space. The resulting Earth energy imbalance, absorbed solar energy exceeding heat emitted to space, causes the planet to warm.
Efforts to assess dangerous climate change have focused on estimating a permissible level of global warming. The Intergovernmental Panel on Climate Change (1, 2) summarized
The fallacy of this logic emerged in recent years as numerous impacts of global warming became apparent. Summer sea ice cover in the Arctic plummeted in 2007 and 2011 to an area 40 percent less than a few decades earlier and Arctic sea ice thickness declined a factor of four faster than simulated in IPCC climate models (4). The Greenland and Antarctic ice sheets began to shed ice at a rate, now several hundred cubic kilometers per year, which is continuing to accelerate (5, 6). Mountain glaciers are receding rapidly all around the world with effects on seasonal freshwater availability of major rivers (7, 8). The hot dry subtropical climate belts have expanded as the troposphere has warmed and the stratosphere cooled
In recognition of observed growing climate impacts while global warming is less than 1°C, reassessment of the dangerous level of warming is needed. Earth's paleoclimate history provides a valuable tool for that purpose.
Paleoclimate Temperature. Global surface temperature in the Pliocene and Pleistocene (Fig. 2) is inferred from the composition of shells of
We concatenate paleoclimate (Fig. 2) and modern (Fig. 1) temperature records via the assumption that peak Holocene temperature (prior to the warming of the past century) was +0.5° ±0.25°C relative to the
5
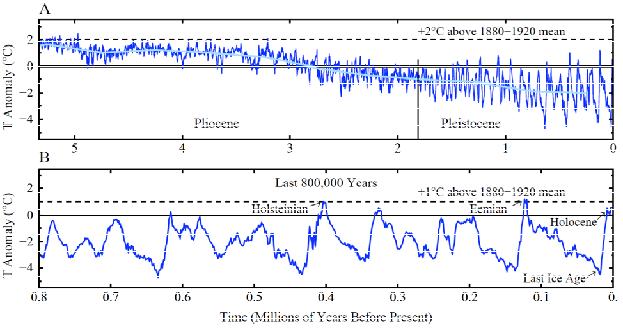
Fig. 2. Global temperature relative to
Climate oscillations evident in Fig. 2 were instigated by small perturbations of Earth's orbit and the tilt of its spin axis relative to the orbital plane that alter the seasonal and geographical distribution of sunlight on the planet (19). These forcings change very slowly, with periods between 20,000 and 400,000 years, and thus the climate is able to stay in quasi- equilibrium with the forcings. The slow insolation changes instigated the climate oscillations in Fig. 2, but the mechanisms that caused the climate changes to be so large were two powerful amplifying feedbacks: the planet's surface albedo (its reflectivity, literally its whiteness) and the atmospheric CO2 amount. As the planet warms, ice and snow melt, causing the surface to be darker, absorb more sunlight and warm further. As the ocean and soil become warmer they release CO2 and other greenhouse gases, causing further warming. These amplifying feedbacks were responsible for almost the entire
Albedo and CO2 feedbacks acted as slaves to weak orbital forcings in the natural climate variations in Fig. 2, changing slowly over millennia. Today, however, CO2 is under the control of humanity as fossil fuel emissions overwhelm natural changes. Atmospheric CO2 has increased rapidly to a level not seen for at least 3 million years (25). Global warming induced by increasing CO2 will cause ice to melt and sea level to rise as the global volume of ice moves toward the
Paleoclimate data yield an estimate of eventual ice melt and sea level rise for a given global warming. The Eemian and Hosteinian interglacial periods (Fig. 2B), also known as marine isotope stages 5e and 11, respectively about 130,000 and 400,000 years ago, were about 1°C warmer than the
6
tectonics, local sediment loading, convective flow in Earth's mantle, and regional vertical movement of the crust due to ice sheet loading or unloading (29), but the data suggest that sea level reached heights as much as
Paleoclimate records are less useful for estimating how fast ice sheets will respond to global warming, because the
Global observations of
Earth's Energy Imbalance
At a time of climate stability, Earth radiates as much energy to space as it absorbs from sunlight. Today Earth is out of balance because increasing atmospheric gases such as CO2 reduce Earth's heat radiation to space, causing an energy imbalance, more energy coming in than going out.
This imbalance causes Earth to warm and move back toward energy balance, but warming and restoration of energy balance are slowed by Earth's thermal inertia, due mainly to the ocean.
The immediate planetary energy imbalance caused by a CO2 increase can be calculated precisely. The radiation physics is rigorously understood and does not require a climate model. But the ongoing energy imbalance is reduced by the fact that Earth has already warmed 0.8°C, thus increasing heat radiation to space. The imbalance is also affected by other factors that alter climate, such as changes of solar irradiance, the reflectivity of Earth's surface, and aerosols.
Determination of the state of Earth's climate therefore requires measuring the energy imbalance. This is a challenge, because the imbalance is expected to be only about 1 W/m2 or less, so accuracy approaching 0.1 W/m2 is needed. The most promising approach is to measure the rate of changing heat content of the ocean, atmosphere, land, and ice (33).
Observed Energy Imbalance. Nations of the world have launched a cooperative program to measure changing ocean heat content, distributing more than 3000 Argo floats around the world ocean, with each float repeatedly lowering an instrument package to a depth of 2 km and back (34). Ocean coverage by floats reached 90% by 2005 (34) , with the gaps mainly in sea ice regions, yielding the potential for an accurate energy balance assessment, provided that several systematic measurement biases exposed in the past decade are minimized (35, 36).
Analysis of the Argo data yields a heat gain in the ocean's upper 2000 m of 0.41 W/m2 averaged over Earth's surface during
This positive energy imbalance in
7
Earth's energy imbalance averaged over the
Implications for CO2 Target. Earth's energy imbalance is the single most vital number characterizing the state of Earth's climate. It informs us about the global temperature change "in the pipeline" without further change of climate forcings. It also defines how much we must reduce greenhouse gases to restore energy balance and stabilize climate, if other forcings remain unchanged. The measured energy imbalance accounts for all natural and
If Earth's mean energy imbalance is +0.5 W/m2, CO2 must be reduced from the current level of 390 ppm to about 360 ppm to increase Earth's heat radiation to space by 0.5 W/m2 and restore energy balance. If Earth's energy imbalance is 0.75 W/m2, CO2 must be reduced to about 345 ppm to restore energy balance (33, 39).
The measured energy imbalance affirms that a good initial CO2 target to stabilize climate near current temperatures is "<350 ppm" (20). Specification of a more precise CO2 target now is difficult and unnecessary, because of uncertain future changes of other forcings including other gases, ground albedo, and aerosols. More precise knowledge of the best target will become available during the time that it takes to turn around CO2 growth and approach the initial 350 ppm target.
Ironically, future reductions of particulate air pollution may exacerbate global warming by reducing the cooling effect of reflective aerosols. However, a concerted effort to reduce non- CO2 forcings by methane, tropospheric ozone, other trace gases and black soot might counteract the warming from a decline in reflective aerosols (39). Our calculations below of future global temperature assume that compensation. If that goal is not achieved, future warming could exceed calculated values.
Carbon Cycle and Atmospheric CO2
The carbon cycle defines the fate of CO2 injected into the air by fossil fuel burning (1, 40) as the CO2 distributes itself over time among surface carbon reservoirs: the atmosphere, ocean, soil, and biosphere. We use the
A pulse of CO2 injected into the air decays by half in about 25 years (Fig. 3), but nearly
A negative CO2 pulse decays at about the same rate as a positive pulse (Fig. 3A), which is an important fact for policy considerations. If it is decided in the future that CO2 must be sucked from the air and removed from the carbon cycle (e.g., by making carbonate bricks or storing the CO2 in underground reservoirs), the effect of the atmospheric CO2 reduction will decline as the negative CO2 increment becomes spread among the carbon reservoirs. The main process limiting the
How fast atmospheric CO2 declines if fossil fuel emissions are instantly terminated (Fig. 3B) is instructive. Halting emissions in 2015 causes CO2 to decline to 350 ppm at the century's end (Fig. 3b). A 20 year delay in halting emissions has CO2 returning to 350 ppm at about 2300. With a 40 year delay, CO2 does not return to 350 ppm until after 3000. These results show how difficult it is to get back to 350 ppm if high emissions continue for even a few decades.
8
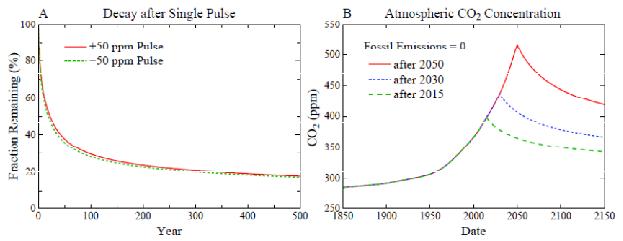
Fig. 3. (A) Decay of instantaneous injection or extraction of atmospheric CO2, (B) CO2 amount if fossil fuel emissions are terminated at the end of 2015, 2030, or 2050. Land use emissions terminate at the end of 2015 in all three cases.
Reforestation and Soil Carbon. The long CO2 lifetime does not make it impossible to return CO2 to 350 ppm this century. Reforestation and increasing soil carbon can help draw down atmospheric CO2, even though the effect on atmospheric CO2 amount decays (Fig. 3a).
Fossil fuels account for about 80% of the CO2 increase from preindustrial 275 ppm to 390 ppm today, with deforestation accounting for the other 20%. Net deforestation to date is estimated to be 100 GtC (gigatons of carbon) with ±50% uncertainty (43).
Although complete restoration of deforested areas is unrealistic, a 100 GtC carbon storage is conceivable because: (1) the
Forest and soil storage of 100 GtC is a challenge, but it has other benefits. Reforestation has been successful in diverse places (45). Minimum tillage with biological nutrient recycling, as opposed to plowing and chemical fertilizers, could sequester
Reforestation may be most beneficial in the tropics (49, 50), avoiding potential unintended impacts of major reforestation elsewhere (51). Net deforestation in recent decades has occurred mostly in the tropics (1, 52), so a large amount of land suitable for reforestation (meeting UNFCCC criteria) exists there (53).
Use of bioenergy to draw down CO2 should employ feedstocks from residues, wastes, and dedicated energy crops that do not compete with food crops, thus avoiding loss of natural ecosystems and cropland
Our reforestation scenarios decrease today's net deforestation rate linearly to zero in 2030, followed by a sinusoidal 100 GtC biospheric carbon storage over
9
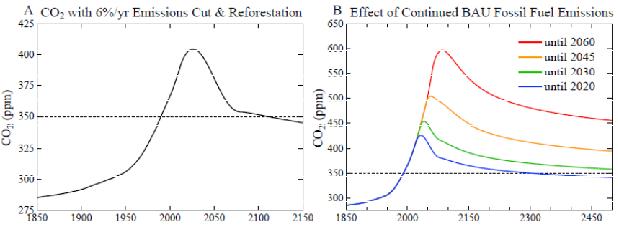
Fig. 4. (A) Atmospheric CO2 if fossil fuel emissions are cut 6%/year beginning in 2013 and 100 GtC reforestation drawdown occurs in
CO2 Emission Reduction Scenarios. A 6%/year decrease of fossil fuel emissions beginning in 2013, with 100 GtC reforestation, achieves a CO2 decline to 350 ppm near the end of this century (Fig. 4A). Cumulative fossil fuel emissions in this scenario are ~136 GtC from 2012 to 2050, with an additional 15 GtC by 2100. If our assumed land use changes occur a decade earlier, CO2 returns to 350 ppm several years earlier, however that has negligible effect on the global temperature maximum calculated below.
Conversely, delaying fossil fuel emission cuts until 2020 (with 2%/year emissions growth in
These results emphasize the urgency of initiating emissions reduction. If emissions reduction had begun in 2005, reduction at 3.5%/year would have achieved 350 ppm at 2100. Now the requirement is at least 6%/year. If we assume only 50 GtC reforestation, the requirement becomes at least 9%/year. Further delay of emissions reductions until 2020 requires a reduction rate of 15%/year to achieve 350 ppm in 2100.
At present there are no technologies capable of
The cost of removing 50 ppm of CO2, at $500/tC, is ~$50 trillion (1 ppm CO2 is ~2.12 GtC), but more than $200 trillion for the price estimate of the American Physical Society study. Moreover, the resulting atmospheric CO2 reduction is only ~15 ppm after 100 years, because the extraction induces counteracting changes in the other surface carbon reservoirs – mainly CO2 outgassing from the ocean (Fig. 3A). The estimated cost of maintaining a 50 ppm reduction on the century time scale is thus
10
Fig. 5. Simulated global temperature relative to
Future Global Temperature Change
Future global temperature change depends primarily on atmospheric CO2. CO2 accounts for more than 80% of the growth of greenhouse gas climate forcing in the past 15 years (62). We approximate the net future change of
Simulated Global Temperature. We calculate global temperature change for a given CO2 scenario using a climate response function that accurately replicates results from a global climate model with sensitivity 3°C for doubled CO2 (33). Climate forcings that we use for the past [Fig. 4 of (62)] are updated annually at http://www.columbia.edu/~mhs119/GHG_Forcing/.
Simulated global temperature is shown in Fig. 5 for the CO2 scenarios of Fig. 4. Peak global warming is ~1.1°C, declining to less than 1°C by
Slow Climate Feedbacks and Tipping Points. Our climate simulations, as with most climate models, incorporate only the effect of fast feedbacks in the climate system, such as water vapor, clouds, aerosols, and sea ice. Slow feedbacks, such as ice sheet disintegration are not included.
Excluding slow feedbacks is appropriate for the past century, because we know the ice sheets were stable and our climate simulations employ observed greenhouse gas amounts that include any changes caused by slow feedbacks. Exclusion of slow feedbacks in the 21st century, however, is a dubious assumption, which we used only because the rate at which slow feedbacks will come into play is unknown.
Slow feedbacks are important because of their impact on threshold or "tipping point" events (20, 63). Climate tipping points occur when climate change reaches a level where further large and possibly rapid changes become inevitable, proceeding mostly under their own momentum. Ice sheets provide an example. Once disintegration of an ice sheet is well underway the dynamics of the process takes over. At that point, reducing greenhouse gases cannot prevent substantial sea level rise.
11
Extermination of species can also reach a tipping point, because of interdependencies among species. Thus climate change that is large enough or fast enough can cause entire ecosystems to collapse, leading to mass extinctions (17).
Methane hydrates – methane molecules trapped in frozen water molecule cages in tundra and on continental shelves (64) – provide another potential tipping point. If methane hydrates thaw on a large scale they could greatly amplify global warming (65), because methane is a powerful greenhouse gas. There is already evidence of methane release from thawing permafrost on land (66) and from
Dangerous Global Warming. Tipping points help define the dangerous level of global warming, even though their nonlinear nature inhibits accurate predictability of temporal details of collapse. Assessment of tipping point threats is aided by the combination of paleoclimate records defining a
Ice sheets and sea level are a prime example. Paleoclimate data indicate that 1°C global warming above preindustrial levels (to the Eemian level) is likely to cause eventual sea level rise of several meters and 2°C (early Pliocene level) could cause eventual sea level rise as great as
Methane hydrates have been implicated by paleoclimate data as a likely principal mechanism in several rapid global warmings (68, 69). This appears to have occurred as a powerful feedback amplifying a natural warming trend
Global warming to date is at most a few tenths of a degree above the prior Holocene range. Impacts on ice sheets and permafrost carbon are small so far, suggesting that these feedbacks may not be a major factor if global warming, now about 0.8°C, reaches a maximum of only ~1°C and then recedes, as in the scenario of Figs. 4A and 5A.
In contrast, the scenarios that reach 2°C or even 1.5°C global warming via only fast feedbacks appear to be exceedingly dangerous. These scenarios run a high risk of the slow feedbacks coming into play in major ways. However, we lack knowledge of how fast the slow feedbacks would occur, and thus which generations would suffer the greatest consequences.
The available information suggests that humanity faces a dichotomy of possible futures. Either we achieve a scenario with declining emissions, preserving a planetary climate resembling the Holocene, or the climate is likely to pass tipping points with amplifying feedbacks that assure transition to a very different planet with both foreseeable and unforeseen consequences.
Likely Impacts of Global Warming
Sea Level. The prior interglacial period, the Eemian, was at most ~1°C warmer than the Holocene (Fig. 2). Sea level reached heights several meters above today's level with instances of sea level change by
12
imply that rapid partial melting of Antarctic and/or Greenland ice occurred when the world was little warmer than today.
During the early Pliocene, which was only
Expected
Most recent estimates of sea level rise by 2100 have been of the order of 1m, notably higher than estimates in earlier assessments (74), and it also has been argued (74, 75) that continued
The important point is that the uncertainty is not about whether continued rapid CO2 emissions would cause large sea level rise – it is about how soon the large changes would begin. If all or most fossil fuels are burned, the carbon will remain in the climate system for many centuries, in which case
Shifting Climate Zones. Theory and climate models indicate that the tropical overturning (Hadley) atmospheric circulation expands poleward with global warming (9). There is evidence in satellite and radiosonde data and in reanalyses output for poleward expansion of the tropical circulation by as much as a few degrees of latitude since the 1970s (10, 11), which likely contributes to expansion of subtropical conditions and increased aridity in the southern United States (7, 76), the Mediterranean region, and southern Australia. Increased aridity and temperature contribute to increased forest fires that burn hotter and are more destructive (12).
Despite large
Humans may adapt to shifting climate zones better than many species. However, political borders can interfere with human migration, and indigenous ways of life already have been adversely affected (74). Impacts are apparent in the Arctic, with melting tundra, reduced sea ice, and increased shoreline erosion. Effects of shifting climate zones also may be important for indigenous Americans who possess specific designated land areas, as well as other cultures with
13
Extermination of Species. Biodiversity is affected by many agents including overharvesting, introduction of exotic species, land use changes, nitrogen fertilization, and direct effects of increased atmospheric CO2 on plant ecophysiology (17). However, easily discernible effects on animals, plants, and insects arising from rapid global warming in the past three decades have exposed the overriding role of climate change.
A sudden widespread decline of frogs, with extinction of entire
A critical factor for survival of some Arctic species is retention of
The threat to species survival is not limited to mountain and polar species. Plant and animal distributions are a reflection of the regional climates to which they are adapted. Although species attempt to migrate in response to climate change, their paths may be blocked by human- constructed obstacles or natural barriers such as coast lines. As the shift of climate zones becomes comparable to the range of some species, less mobile species can be driven to extinction. Because of extensive species interdependencies, this can lead to mass extinctions.
IPCC (74) reviewed studies relevant to estimating eventual extinctions. They estimate that if global warming exceeds 1.6°C above preindustrial,
Mass extinctions occurred several times in Earth's history (86), often in conjunction with rapid climate change. New species evolved over millions of years, but those time scales are almost beyond human comprehension. If we drive many species to extinction we will leave a more desolate planet for our children, grandchildren, and more generations than we can imagine.
Coral Reef Ecosystems. Coral reefs are the most biologically diverse marine ecosystem, often described as the rainforests of the ocean. Over a million species, most not yet described (87), are estimated to populate coral reef ecosystems generating crucial ecosystem services for at least 500 million people in tropical coastal areas. These ecosystems are highly vulnerable to the combined effects of ocean acidification and warming.
Acidification arises as the ocean absorbs CO2, producing carbonic acid (88). Geochemical records show that ocean pH is already outside its range of the past several million years (89, 90). Warming causes coral bleaching, as overheated coral expel symbiotic algae and become vulnerable to disease and mortality (91). Coral bleaching and slowing of coral
14
calcification already are causing mass mortalities, increased coral disease, and reduced reef carbonate accretion, thus disrupting coral reef ecosystem health (14, 92).
Local
Climate Extremes. Extremes of the hydrologic cycle are expected to intensify in a warmer world. A warmer atmosphere holds more moisture, so heavy rains become more intense, bringing more frequent and intense flooding. Higher temperatures, on the other hand, increase evaporation and intensify droughts, as does expansion of the subtropics with global warming. Heat waves lasting for weeks have a devastating impact on human health: the European heat wave of summer 2003 caused over 70,000 excess deaths (93). This heat record for Europe was surpassed already in 2010 (94). The number of extreme heat waves has increased
IPCC reports (2, 74) confirm that precipitation has generally increased over land poleward of the subtropics and decreased at lower latitudes. Unusually heavy precipitation events have increased in Europe, North America, Southeast Asia and Australia. Droughts are more common, especially in the tropics and subtropics.
Glaciers are in
Human Health. Climate change causes a variety of human health impacts, with children especially vulnerable. These include food shortages, polluted air, and contaminated or scarce supplies of water, along with an expanding area of vectors causing infectious diseases and more intensely allergenic plants. World health experts have concluded with "very high confidence" that climate change already contributes to the global burden of disease and premature death (74).
IPCC (74) projects the following trends, if CO2 emissions and global warming continue to increase, where only trends assigned very high confidence or high confidence are included: (i) increased malnutrition and consequent disorders, including those related to child growth and development, (ii) increased death, disease and injuries from heat waves, floods, storms, fires and droughts, (iii) increased
With the growing awareness of the consequences of
The Supporting Information has further discussion of health impacts of climate change.
15
Implications for Humanity
Fossil fuel emissions to date are a small fraction of potential emissions from known reserves and potentially recoverable resources (Fig. P1). Although there are uncertainties in reserves and resources, ongoing fossil fuel subsidies and continuing technological advances ensure that more and more of these fuels will be economically recoverable.
Burning all fossil fuels would create a very different planet than the one that humanity knows. The paleoclimate record and ongoing climate change make it clear that the climate system would be pushed beyond tipping points, setting in motion irreversible changes, including ice sheet disintegration with a continually adjusting shoreline, extermination of a substantial fraction of species on the planet, and increasingly devastating regional climate extremes.
Initiation of
Most proposed schemes to artificially restore Earth's energy balance aim to reduce solar heating, e.g., by maintaining a haze of stratospheric particles that reflect sunlight to space. Such attempts to mask one pollutant with another pollutant almost inevitably would have unintended consequences. Moreover, schemes that do not remove CO2 would not avert ocean acidification.
The implication is that the world must move expeditiously to
Air and water pollution from fossil fuel extraction and use have high costs in human health, food production, and natural ecosystems, costs borne by the public. Huge costs of climate change and ocean acidification also are borne by the public, especially young people and future generations.
Thus the essential underlying policy, albeit not sufficient, is for emissions of CO2 to come with a price that allows these costs to be internalized within the economics of energy use. The price should rise over decades to enable people and businesses to efficiently adjust their lifestyles and investments to minimize costs. The right price for carbon and the best mechanism for carbon pricing are more matters of practicality than of economic theory.
Economic analyses indicate that a carbon price fully incorporating environmental and climate damage would be high (96). The cost of climate change is uncertain to a factor of 10 or more and could be as high as ~$1000/tCO2 (97). While the imposition of such a high price on carbon emissions is outside the realm of
An economic analysis indicates that a tax beginning at $15/tCO2 and rising $10/tCO2 each year would reduce emissions in the U.S. by 30% within 10 years (98). Such a reduction is more than 10 times as great as the carbon content of tar sands oil carried by the proposed Keystone XL pipeline (830,000 barrels/day) (99). Reduced oil demand would be nearly six times the pipeline capacity (98), thus rendering it superfluous.
Relative merits of a carbon tax and
16
Republicans for Environmental Protection (101) as: "Transparent.
A rising carbon emissions price is the sine qua non for fossil fuel phase out. However, it is not sufficient. Governments also should encourage investment in energy R&D and drive energy and carbon efficiency standards for buildings, vehicles and other manufactured products. Investment in global climate monitoring systems and support for climate mitigation and adaptation in undeveloped countries are also needed.
Despite evidence that a rising carbon price and these supplementary actions would drastically shrink demand for fossil fuels, governments and businesses are rushing headlong into expanded extraction and use of all fossil fuels. How is it possible that large
– have stepped in to safeguard the future of young people? A strong case can be made that the absence of effective leadership in most nations is related to the undue sway of special financial interests on government policies aided by pervasive public relations efforts by organizations that profit from the public's addiction to fossil fuels and wish to perpetuate that dependence (102, 103).
A situation in which scientific evidence cries out for action, but a political response is impeded by the financial power of special interests, suggests the possibility of an important role for the judiciary system. Indeed, in some nations the judicial branch of government may be able to require the executive branch to present realistic plans to protect the rights of the young (104). Such a legal case for young people should demand plans for emission reductions that are consistent with what the science shows is required to stabilize climate. Judicial recognition of both the exigency of the climate problem and the rights of young people, we believe, will help draw attention to the need for a rapid change of direction.
Nevertheless, fundamental change is unlikely without public support. Gaining that support requires widespread recognition that a prompt orderly transition to the post fossil fuel world, via a rising price on carbon emissions, is technically feasible and may even be economically beneficial apart from the benefits to climate.
The most basic matter is not one of economics, however. It is a matter of morality – a matter of intergenerational justice. As with the earlier great moral issue of slavery, an injustice done by one race of humans to another, so the injustice of one generation to others must stir the public's conscience to the point of action. Until there is a sustained and growing public involvement, it is unlikely that the needed fundamental change of direction can be achieved.
A broad public outcry may seem unlikely given the enormous resources of the fossil fuel industry, which allows indoctrination of the public with the industry's perspective. The merits of coal, of oil from tar sands and the deep ocean, of gas from hydrofracking are repeatedly extolled, all of these supposedly to be acquired with utmost care of the environment. Potential climate concerns are addressed, if at all, by discrediting climate science and scientists (102).
Yet human cultures have long revered the environment and other life on the planet, and an obligation to future generations is broadly recognized. Religious leaders have expressed support for ameliorating the causes of
17
describes support for actions to stem climate change by an array of religions in the United States spanning Evangelical, mainline Protestant, Catholic, Jewish, and Eastern Orthodox faiths.
Indigenous people and people in developing countries have done little to cause climate change but will likely suffer some of the worst consequences. Many are resisting exploitation of their land and peacefully demanding policy changes. Indigenous people, farmers, scientists, environmentalists and other members of the public have peacefully demonstrated against new fossil fuel developments such as the tar sands Keystone pipeline (107) and hydrofracking in the Delaware River Basin.
Considering the stakes involved, it is disquieting that young people have not become more involved in the issue of the planet's future and more insistent on intergenerational justice. The tentative efforts to pursue legal redress, for which our present paper provides scientific rationale and quantification, are an effort of adults on behalf of young people. In the case of the very young, their inactivity is understandable.
Yet it is possible to imagine a scenario in which a social tipping point is reached and the world begins to rapidly phase out fossil fuel emissions. When public concern reaches a high level, some influential leaders of the energy industry, well aware of the moral issue, could join the campaign to phase out fossil fuel emissions. Many business leaders recognize the merits of a rising price on carbon emissions, and likely would be supportive of such an approach once they realize that large rapid emission reductions are essential. Given the relative ease with which a carbon price can be made international (100), a rapid phasedown of emissions may be feasible. As fossil fuels are made to pay their costs to society, energy efficiency and clean energies could themselves reach a tipping point where they begin to be rapidly adopted.
Can the human tipping point be reached before the climate system passes a point of no return? What we have shown in this paper is that time is rapidly running out. The era of doubts, delays and denial, of ineffectual
Acknowledgements. This paper is dedicated to Paul Epstein, a fervent defender of the health of humans and the environment, who graciously provided important inputs to this paper in the spring and summer of 2011 while battling late stages of
References
1.Intergovernmental Panel on Climate Change (IPCC), 2007: Climate Change 2007: The Physical Science Basis. Solomon, S., et al. eds., Cambridge University Press, 996 pp
2.Intergovernmental Panel on Climate Change (IPCC), 2001: Climate Change 2001: The Scientific Basis. Houghton, J. T., et al. eds., Cambridge University Press, 996 pp
18
3.Schneider, S.H. and Mastrandrea, M.D., 2005: Probabilistic assessment "dangerous" climate change and emissions pathways. Proc Nat Acad Sci, 102,
4.Rampal, P., Weiss, J., Dubois, C., and Campin, J.M., 2011: IPCC climate models do not capture Arctic sea ice drift acceleration: Consequences in terms of projected sea ice thinning and decline. J Geophys Res, 116, C00D07.
5.Velicogna, I., 2009: Increasing rates of ice mass loss from the Greenland and Antarctic ice sheets revealed by GRACE. Geophys Res Lett, 36, L19503.
6.Rignot, E., Velicogna, I., van den Broeke, M.R., Monaghan, A., and Lenaerts, J., 2011: Acceleration of the contribution of the Greenland and Antarctic ice sheets to sea level rise. Geophys Res Lett, 38,
7.Barnett, T.P., et al., 2008:
8.Kaser, G., Grosshauser, M., and Marzeion, B., 2010: Contribution potential of glaciers to water availability in different climate regimes. Proc Nat Acad Sci, 107,
9.Held, I.M. and Soden, B.J., 2006: Robust responses of the hydrological cycle to global warming. J Clim, 19,
10.Seidel, D.J., Fu, Q., Randel, W.J., and Reichler, T.J., 2008: Widening of the tropical belt in a changing climate. Nat Geosci, 1,
11.Davis, S.M. and Rosenlof, K.H., 2011: A
12.Westerling, A.L., Hidalgo, H.G., Cayan, D.R., and Swetnam, T.W., 2006: Warming and earlier spring increase western US forest wildfire activity. Science, 313,
13.Bruno, J.F. and Selig, E.R., 2007: Regional decline of coral cover in the
14.
15.Veron, J.E., et al., 2009: The coral reef crisis: The critical importance of < 350 ppm CO(2). Mar Pollut Bull, 58,
16.Parmesan, C. and Yohe, G., 2003: A globally coherent fingerprint of climate change impacts across natural systems. Nature, 421,
17.Parmesan, C., 2006: Ecological and evolutionary responses to recent climate change. Annu. Rev. Ecol. Syst., 37,
18.Rahmstorf, S. and Coumou, D., 2011: Increase of extreme events in a warming world. Proc Nat Acad Sci, 108,
19.Zachos, J., Pagani, M., Sloan, L., Thomas, E., and Billups, K., 2001: Trends, rhythms, and aberrations in global climate 65 Ma to present. Science, 292,
19
20.Hansen, J., et al., 2008: Target Atmospheric CO2: Where Should Humanity Aim? The Open Atmospheric Science Journal, 2,
21.Hansen, J.E. and Sato, M., Berger, A., Mesinger, F., and Sijacki, D., 2012: Paleoclimate implications for
22.Hansen, J., et al., 2007: Climate change and trace gases. Philos Trans R Soc A, 365,
23.Kohler, P., et al., 2010: What caused Earth's temperature variations during the last 800,000 years?
24.Rohling, E.J., M.
25.Pagani, M., Liu, Z.H., LaRiviere, J., and Ravelo, A.C., 2010: High
26.Rohling, E.J., et al., 2008: High rates of
27.Thompson, W.G., Curran, H.A., Wilson, M.A., and White, B., 2011:
28.Hearty, P.J., Hollin, J.T., Neumann, A.C., O'Leary, M.J., and McCulloch, M., 2007: Global
29.Raymo, M.E., Mitrovica, J.X., O'Leary, M.J., DeConto, R.M., and Hearty, P.L., 2011: Departures from eustasy in Pliocene
30.Naish, T.R. and Wilson, G., 2009: Constraints on the amplitude of
31.Hill, D.J., Haywood, D.M., Hindmarsh, R.C.M., and Valdes, P.J. (2007) Characterizing ice sheets during the Pliocene: evidence from data and models.
32.Dwyer, G.S. and Chandler, M.A., 2009:
33.Hansen, J., Mki. Sato, P. Kharecha, and Schuckmann, K.v., 2011: Earth's Energy Imbalance and Implications. Atmos Chem Phys, 11,
34.Roemmich, D. and Gilson, J., 2009: The
35.Lyman, J.M., et al., 2010: Robust warming of the global upper ocean. Nature, 465,
20
36.Barker, P.M., Dunn, J.R., Domingues, C.M., and Wijffels, S.E., 2011: Pressure Sensor Drifts in Argo and Their Impacts. J Atmos Ocean Tech, 28,
37.von Schuckmann, K. and LeTraon,
38.Frohlich, C. and Lean, J., 1998: The Sun's total irradiance: Cycles, trends and related climate change uncertainties since 1976. Geophys Res Lett, 25,
39.Hansen, J., Sato, M., Ruedy, R., Lacis, A., and Oinas, V., 2000: Global warming in the
40.Archer, D., 2007: Methane hydrate stability and anthropogenic climate change. Biogeosciences, 4,
41.Joos, F., et al., 1996: An efficient and accurate representation of complex oceanic and biospheric models of anthropogenic carbon uptake. Tellus (B Chem. Phys. Meteorol.), 48,
42.Kharecha, P.A. and Hansen, J.E., 2008: Implications of "peak oil'' for atmospheric CO2 and climate.
Global Biogeochem Cy, 22, GB3012.
43.Stocker, B.D., Strassmann, K., and Joos, F., 2011: Sensitivity of Holocene atmospheric CO2 and the modern carbon budget to early human land use: analyses with a
Biogeosciences, 8,
44.Hillel, D. and Rosenzweig, C., eds. 2011: Handbook of Climate Change and Agroecosystems: Impacts, Adaptation and Mitigation (Imperial College Press, London).
45.Lamb, D., 2011: Regreening the Bare Hills. Springer, New York, 547 pp.
46.Smith, P., et al., 2008: Greenhouse gas mitigation in agriculture. Philos T R Soc B, 363,
47.Smith, P., 2012: Agricultural greenhouse gas mitigation potential globally, in Europe and in the UK: what have we learned in the last 20 years? . Global Change Biol., 18,
48.Smith, P., et al., 2010: Competition for land. Philos T R Soc B, 365,
49.Bala, G., et al., 2007: Combined climate and
50.Bonan, G.B., 2008: Forests and climate change: Forcings, feedbacks, and the climate benefits of forests. Science, 320,
51.Swann, A.L.S., Fung, I.Y., and Chiang, J.C.H., 2011:
52.Pan, Y.D., et al., 2011: A Large and Persistent Carbon Sink in the World's Forests. Science, 333,
21
53.Zomer, R.J., Trabucco, A., Bossio, D.A., and Verchot, L.V., 2008: Climate change mitigation: A spatial analysis of global land suitability for clean development mechanism afforestation and reforestation. Agr Ecosyst Environ, 126,
54.Tilman, D., Hill, J., and Lehman, C., 2006:
55.Fargione, J., Hill, J., Tilman, D., Polasky, S., and Hawthorne, P., 2008: Land clearing and the biofuel carbon debt. Science, 319,
56.Searchinger, T., et al., 2008: Use of US croplands for biofuels increases greenhouse gases through emissions from
57.Stehfest, E., et al., 2009: Climate benefits of changing diet. Clim Chg, 95,
58.United Nations Environment Programme (UNEP), 2010: Assessing the Enviromental Impacts of Consumption and Production: Priority Products and Materials. Hertwich, E., et al., www.unep.org/resourcepanel/Publications/PriorityProducts/tabid/56053/Default.aspx.
59.The Royal Society, 2009: Geoengineering the climate: science, governance and uncertainty.
60.Keith, D.W.,
61.American Physical Society, 2011: Direct Air Capture of CO2 with Chemicals: A Technology Assessment for the APS Panel on Public Affairs. : http://www.aps.org/policy/reports/assessments/upload/dac2011.pdf accessed Jan 11, 2012.
62.Hansen, J. and Sato, M., 2004: Greenhouse gas growth rates. Proc Nat Acad Sci, 101,
63.Lenton, T.M., et al., 2008: Tipping elements in the Earth's climate system. Proc. Natl. Acad. Sci, 105,
64.Max, M.D., 2003: Natural Gas Hydrate in Oceanic and Permafrost Environments. Kluwer Academic Publishers,, ISBN
65.Kvenvolden, K.A., 1993: Gas Hydrates - Geological Perspective and Global Change. Rev Geophys, 31,
66.Walter, K., Zimov, S., Chanton, J., Verbyla, D., and Chapin, F., 2006: Methane bubbling from Siberian thaw lakes as a positive feedback to climate warming. Nature, 443,
67.Shakhova, N., et al., 2010: Extensive Methane Venting to the Atmosphere from Sediments of the East Siberian Arctic Shelf. Science, 327,
68.Lourens, L.J., et al., 2005: Astronomical pacing of late Palaeocene to early Eocene global warming events. Nature, 435,
69.Zachos, J.C., Dickens, G.R., and Zeebe, R.E., 2008: An early Cenozoic perspective on greenhouse warming and
22
70.Lunt, D.J., et al., 2011: A model for orbital pacing of methane hydrate destabilization during the Palaeogene. Nat Geosci, 4,
71.Muhs, D.R., Simmons, K.R., Schumann, R.R., and Halley, R.B., 2011:
72.Hearty, P.J. and Neumann, A.C., 2001: Rapid sea level and climate change at the close of the Last Interglaciation (MIS 5e): evidence from the Bahama Islands. Quat. Sci. Rev., 20,
73.Rignot, E., et al., 2008: Recent Antarctic ice mass loss from radar interferometry and regional climate modelling. Nat Geosci, 1,
74.Hansen, J.E., 2007: Scientific reticence and sea level rise. Env Res Lett, 2, 024002.
75.Hansen, J.E., 2005: A slippery slope: How much global warming constitutes "dangerous anthropogenic interference"? Clim Chg, 68,
76.Levi, B.G., 2008: Trends in the hydrology of the western US bear the imprint of manmade climate change. Physics Today, 61,
77.Hansen, J., et al., 2006: Global temperature change. Proc Nat Acad Sci, 103,
78.Burrows, M.T., et al., 2011: The Pace of Shifting Climate in Marine and Terrestrial Ecosystems. Science, 334,
79.Seimon, T.A., et al., 2007: Upward range extension of Andean anurans and chytridiomycosis to extreme elevations in response to tropical deglaciation. Global Change Biol., 13,
80.
81.Pounds, J.A., Fogden, M.P.L., and Campbell, J.H., 1999: Biological response to climate change on a tropical mountain. Nature, 398,
82.Pounds, J.A., et al., 2006: Widespread amphibian extinctions from epidemic disease driven by global warming. Nature, 439,
83.Alford, R.A., Bradfield, K.S., and Richards, S.J., 2007: Ecology: Global warming and amphibian losses. Nature, 447,
84.Rosa, I.D., Simoncelli, F., Fagotti, A., and Pascolini, R., 2007: Ecology: The proximate cause of frog declines? Nature, 447,
85.Pounds, J.A., et al., 2007: Ecology - Pounds et al. reply. Nature, 447,
86.Raup, D.M. and Sepkoski, J.J., 1982: Mass Extinctions in the Marine Fossil Record. Science, 215,
87.
Biodiversity II: Understanding and Protecting Our Biological Resources,
23
88.Caldeira, K. and Wickett, M.E., 2003: Oceanography: Anthropogenic carbon and ocean pH. Nature, 425,
89.2005: Ocean acidification due to increasing atmospheric carbon dioxide. London Royal Society, Raven, J., et al.,
90.Pelejero, C., Calvo, E., and
Trends Ecol Evol, 25,
91.
Mar Freshwater Res, 50,
92.De'ath, G., Lough, J.M., and Fabricius, K.E., 2009: Declining Coral Calcification on the Great Barrier Reef. Science, 323,
93.Robine, J.M., et al., 2008: Death toll exceeded 70,000 in Europe during the summer of 2003. C. R. Biol., 331,
94.Barriopedro, D., Fischer, E.M., Luterbacher, J., Trigo, R., and
95.Stott, P.A., Stone, D.A., and Allen, M.R., 2004: Human contribution to the European heatwave of 2003. Nature, 432,
96.Stern, N., 2007: Stern Review on the Economics of Climate Change Cambridge Univ. Press, Cambridge, UK.
97.Ackerman, F., DeCanio, S., Howarth, R., and Sheeran, K., 2009: Limitations of integrated assessment models of climate change. Clim Chg, 95,
98.Komanoff, C., 2011:
99.United States Department of State, 2011: Final Environmental Impact Statement: http://www.keystonepipeline- xl.state.gov/clientsite/keystonexl.nsf/Fact%20Sheet.pdf?OpenFileResource accessed 28 December 2011.
100.Hsu,
101.Dipeso, J., 2010: Jim Hansen's conservative climate plan, blog post at Republican's for Environmental Protection, October 11, 2010:
102.Oreskes, N. and Conway, E.M., 2010: Merchants of Doubt: How a Handful of Scientists Obscured the Truth on Issues from Tobacco Smoke to Global Warming. Bloomsbury Press, 355 pp., merchantsofdoubt.org.
103.Hansen, J., 2009: Storms of My Grandchildren. Bloomsbury, New York, 304 pp.
24
104.Wood, M.C. (2009): Atmospheric Trust Litigation, Adjudicating Climate Change:
105.Thavis, J., 2011: Pope urges international agreement on climate change,November 28, 2011: http://www.catholicnews.com/data/stories/cns/1104646.htm accessed December 31, 2011.
106.Dalai Lama (2009) Endorsement of a safe level for atmospheric carbon dioxide. A Buddhist Response to the Climate Emergency, Stanley, J., Loy, D. R., and Dorje, G. eds, Wisdom Publications, pp
107.McKibben, B., The Keystone Pipeline Revolt: Why Mass Arrests are Just the Beginning, Rolling Stone.
108.Hansen, J., Ruedy, R., Sato, M., and Lo, K., 2010: Global Surface Temperature Change. Rev Geophys, 48, RG4004.
Supplementary Material
Sea Level Change
Recent estimates of sea level rise by 2100 are around 1 m (1, 2).
Accurate measurements of ice sheet mass loss may provide the best means to detect nonlinear change. The GRACE satellite, measuring Earth's gravitational field since 2003, reveals that the Greenland ice sheet is losing mass at an accelerating rate, now more than 200 km3/year, and Antarctica is losing more than 100 km3/year (7, 8). However, the present rate of sea level rise, 3 cm/decade, is moderate, and the ice sheet mass balance record is too short to determine whether we have entered a period of continually accelerating ice loss.
Satellite observations show that the Greenland surface area with summer melting has increased over the period of record, which extends from the late 1970s (9, 10). A destabilizing mechanism of possibly greater concern is melting of ice shelves, the tongues of ice that extend into the oceans, buttress the ice sheets, and limit the rate of discharge of ice into the ocean. Ocean warming is causing shrinkage of ice shelves around Greenland and Antarctica (11).
Most of the West Antarctic ice sheet, which alone could raise sea level by
Rapid global warming of at least 5°C at the
The most common interpretation is that the carbon originated mainly from melting of methane hydrates, because of the difficulty of identifying other large sources. One suggested alternative carbon
25
source is release from Antarctic permafrost and peat (18). One reason for questioning the methane hydrate source, whether that source could be large enough given the warmer ocean at that time, has been affirmatively addressed (19). Regardless of the carbon source, PETM occurred during a
The PETM witnessed global scale disruption of marine and terrestrial ecosystems with mass migration, temporary redistribution of many species toward higher latitude, and rapid evolution, particularly toward dwarfism of mammals, but with only minor extinctions (15). The evolution toward smaller body size may have been a result of a decline in biological productivity and food availability (20).
An important point is that the magnitude of the PETM carbon injection and warming is comparable to what will occur if humanity burns most of the fossil fuels, but the
Human Health
If fossil fuel emissions continue to increase rapidly, as in the
Infectious Disease. Increased temperature and flooding facilitate spread of infectious diseases by increasing the range and frequency of conditions favoring
Crop Pests and Disease. Warming fortifies pests and weakens hosts in forests, agricultural systems, and marine life. Warmer winters allow pine bark beetles to overwinter and expand their range, to the detriment of boreal forests. Climate trends also favor expansion of the Asian
Heat Waves and Droughts. Global warming, although "only" 0.8°C in the past century, is already sufficient to substantially increase the likelihood of extreme heat waves and droughts. The probability of occurrence of extreme anomalies as great as the Moscow heat wave in 2010 and the Texas/Oklahoma heat wave and drought of 2011 has increased by several times because of global warming (22), and the probability will increase even further if global warming continues to increase. Heat waves cause illness and death and also can lead to an increase in aggression, including violent assaults (23) and suicide (24).
Food Insecurity. Food supplies are compromised by increasing climate extremes, crop pests, and displacement of food crops by biofuel crops (21). Unusually extensive droughts and floods in 2010
26
caused widespread grain shortages and raised food prices, causing food riots in Uganda and Burkina Faso and likely contributing to political instability and uprisings in North Africa and the Middle East. Food shortages and price hikes contribute to malnutrition and poor health that increase vulnerability to infectious diseases, and also are frequently factors in conflicts and wars (21).
Religions and Climate
There is widespread support among religions for preserving climate and the environment. An indicative sample of religious statements follows.
World Council of Churches. At their meeting in Geneva Switzerland on
Evangelicals. Evangelical organizations are diverse, but leaders of American evangelical faiths have issued an evangelical call to action concerning climate change, recognizing a responsibility to offer
Jewish Faith. The Central Conference of American Rabbis adopted a resolution on climate change at their 116th annual convention in Houston Texas in March 2005, concluding that Jewish and secular moral principles imply an obligation to minimize climate change, to live within the ecological limits of Earth, and to not compromise the ecological or economic security of future generations (http://nrccc.org/?page_id=50).
Orthodox Faith. Patriarch Bartholomew II and the Standing Conference of Orthodox Bishops in America on 25 May 2007, in a "Global Climate Change: A Moral and Spiritual Challenge," concluded that care of the environment is an urgent issue, and that for humans to degrade the integrity of the Earth by causing changes in its climate is a sin (http://nrccc.org/?page_id=34).
Catholic Faith. Pope Benedict urged delegates at the United Nations climate conference to reach agreement on a responsible credible response to the the complex and disturbing effects of climate change (http://thinkprogress.org/romm/2011/11/29/377462).
Southern Africa Religions. Religious leaders from across South Africa met in Lusaka Zambia on
Canadian Interfaith. Representatives of Canadian faith communities in 2011 stated their united conviction that the growing crisis of climate change needs to be met by solutions that draw upon the moral and spiritual resources of the world's religious traditions (http://www.cpj.ca/files/docs/Catalyst-
References
1.Vermeer, M. and Rahmstorf, S., 2009: Global sea level linked to global temperature. Proc Nat Acad Sci, 106,
2.Grinsted, A., Moore, J., and Jevrejeva, S., 2010: Reconstructing sea level from paleo and projected temperatures 200 to 2100 AD. Clim Dyn, 34,
3.Pfeffer, W. T., Harper, J. T., and O'Neel, S., 2008: Kinematic constraints on glacier contributions to
27
4.Turner J. et al. (eds.), 2009: Antarctic Climate change and the environment: a contribution to the International Polar year
5.Hansen, J., 2005: A slippery slope: How much global warming constitutes "dangerous anthropogenic interference"? Clim Chg, 68,
6.Hansen, J., 2007: Scientific reticence and sea level rise. Env Res Lett, 2 024002.
7.Sorensen, L. S. and Forsberg, R., 2010: Greenland Ice Sheet Mass Loss from GRACE Monthly Models. Gravity, Geoid and Earth Observation, 135,
8.Rignot, E., Velicogna, I., van den Broeke, M. R., Monaghan, A., and Lenaerts, J., 2011: Acceleration of the contribution of the Greenland and Antarctic ice sheets to sea level rise.
Geophys Res Lett, 38 L05503.
9.Steffen, K., Nghiem, S. V., Huff, R., and Neumann, G., 2004: The melt anomaly of 2002 on the Greenland Ice Sheet from active and passive microwave satellite observations. Geophys Res Lett, 31 L20402.
10.Tedesco, M., et al., 2011: The role of albedo and accumulation in the 2010 melting record in Greenland. Env Res Lett, 6 014005.
11.Rignot, E. and Jacobs, S. S., 2002: Rapid bottom melting widespread near Antarctic ice sheet grounding lines. Science, 296,
12.Rignot, E., et al., 2008: Recent Antarctic ice mass loss from radar interferometry and regional climate modelling. Nat Geosci, 1,
13.Kennett, J. P., Stott, L. D.,, 1991: Abrupt deep sea warming, paleoceanographic changes, and benthic extinctions at the end of the Palaeocene:. Nature, 353,
14.Zachos, J., Pagani, M., Sloan, L., Thomas, E., and Billups, K., 2001: Trends, rhythms, and aberrations in global climate 65 Ma to present. Science, 292,
15.McInerney, F. A., Wing, S.L. , 2011: The
16.Zeebe, R. E., Zachos, J. C., and Dickens, G. R., 2009: Carbon dioxide forcing alone insufficient to explain
17.Cui, Y., et al., 2011: Slow release of fossil carbon during the
18.DeConto, R., Galeotti, S., Pagani, M., Tracy, D.M., Pollard, D., Beerling, D.J.. 2010: Hyperthermals and orbitally paced permafrost soil organic carbon dynamics. Geophys Res Abstracts, 13,
19.Gu, G., Dickens, G.R., Bhatnagar, G. Colwell, F.S., Hirasaki G.J., Chapman, W.G., 2011: Abundant Early Palaeogene marine gas hydrates despite warm
20.Chester, S., Bloch, J., Secord, R., Boyer, D., 2010: A new
21.Intergovernmental Panel on Climate Change (IPCC), 2007: Climate Change 2007, Impacts, Adaptation and Vulnerability, M.L. Parry, E. A. ed., Cambridge Univ Press, 996 pp.
22.Diaz, R. J., Rosenberg, R., 2008: Spreading dead zones and consequences for marine ecosystems. Science, 321,
23.Bushman, B. J., Wang, M. C., and Anderson, C. A., 2005: Is the Curve Relating Temperature to Aggression Linear or Curvilinear? Assaults and Temperature in Minneapolis Reexamined. J Personality, Social Psychology, 89,
24.Page, L. A., Hajat, S. Kovats, R.S., 2007: Relationship between daily suicide counts and temperature in England and Wales British J Psych, 191,
28
Please read our Terms of Service which you agree to by using our services.
Please read our Terms of Service which you agree to by using our services.
Please read our Terms of Service which you agree to by using our services.